
Update: This article was last updated on 17th February 2024 to reflect the accuracy and up-to-date information on the page.
By now, all teachers and professors know that visuals are the most effective form of learning because they’re easier to understand and memorize. Therefore, they are a preferred form of learning and teaching in educational institutions across the globe.
As per research by the European Journal of Cognitive Psychology, people remember 65% of information if it is presented in a visual form. On the other hand, they only remember 10% of the same information when received via hearing or in a text format.
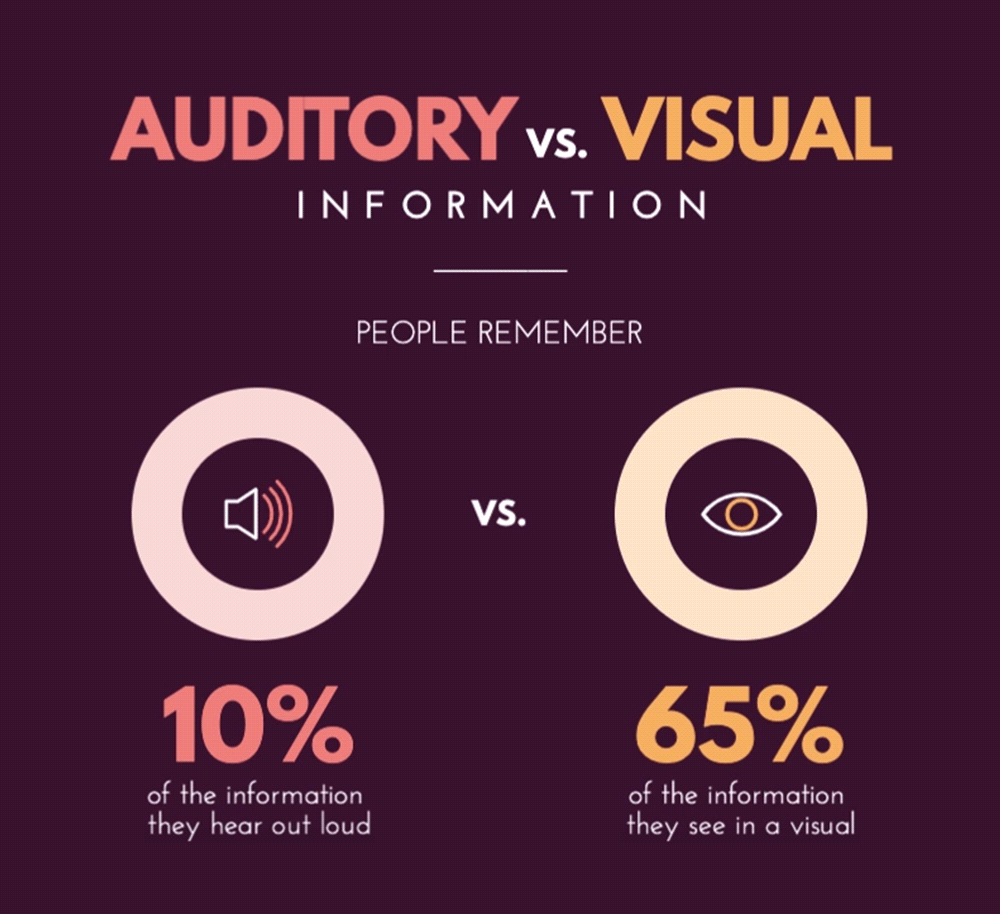
Source: Visme
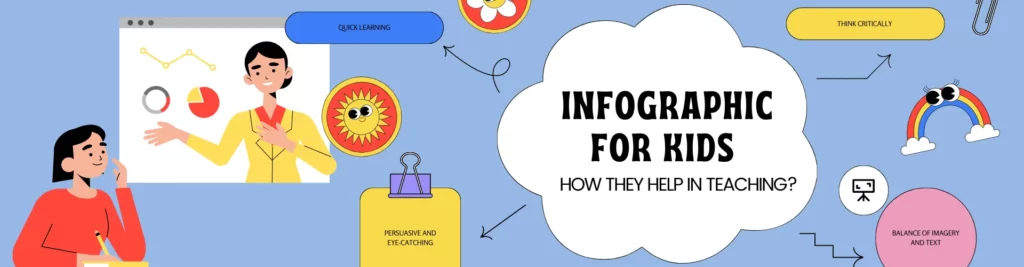
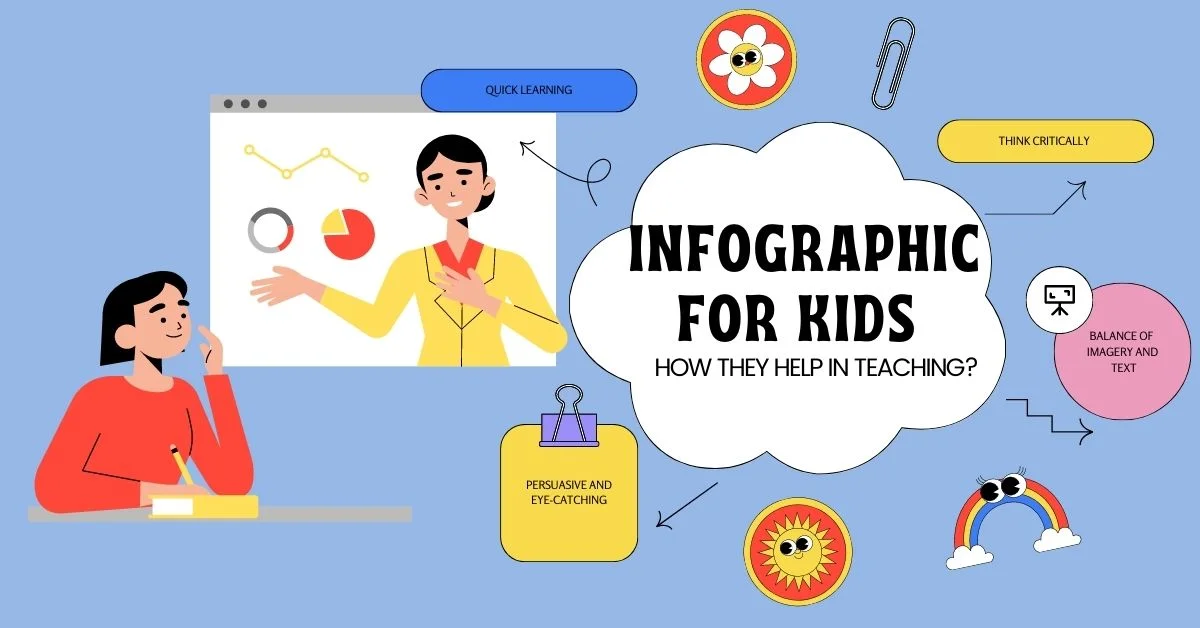
Infographics are used to visually represent any form of complex data, information, or ideas that use charts, graphs, icons, images, and other visual elements to convey a message more effectively and efficiently. Infographics can help kids to understand complex information in a more simplified and appealing way.
Infographics can be presented in various forms that may include; statistical charts, diagrams, timelines, flowcharts, and maps. They can also include text, headings, captions, and labels to provide additional context and information.
Benefits of Using Infographics in School
Infographics can act as a valuable teaching tool for kids because they present information in a visually engaging and easy-to-understand way. Here are some ways that infographics can help kids in teaching:
1. Visual Representation
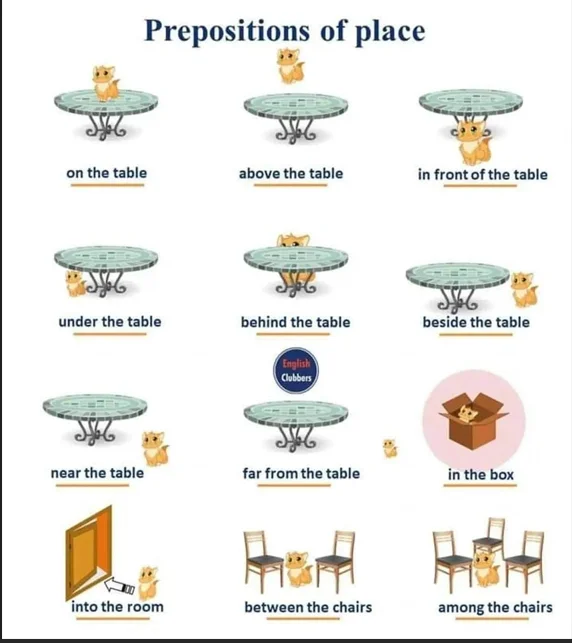
Source: English Grammar
Teachers can make complex concepts look simple and clear by adding visuals and text while teaching their students in schools. Using visually appealing techniques such as adding colors, images, and charts along with textual references can make abstract ideas more concrete and easier to grasp.
2. Enhanced Retention
Children are often more engaged when presented with visual materials, especially if they are colorful, creative, and eye-catching. Infographics can help to make learning more interesting and fun, which can help kids to stay focused and retain information.
Infographics can help kids remember information more efficiently because they engage both the visual and verbal parts of the brain. This can lead to better retention and understanding of key concepts.
3. Improved Communication
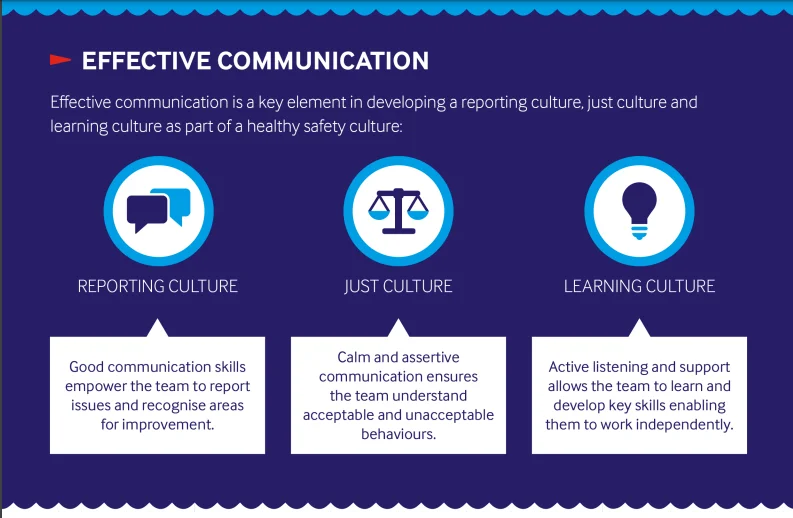
When teachers present complex concepts and information in a simplified, easy-to-understand format, communication between the students and teachers is enhanced. Using visual aids and graphics helps teachers to better comprehend information that might otherwise be difficult to grasp by kids.
Moreover, infographics can help kids develop better communication skills by teaching them how to present information in a clear, concise, and visually appealing way. This is a valuable skill that can be applied to many different contexts.
4. Creativity
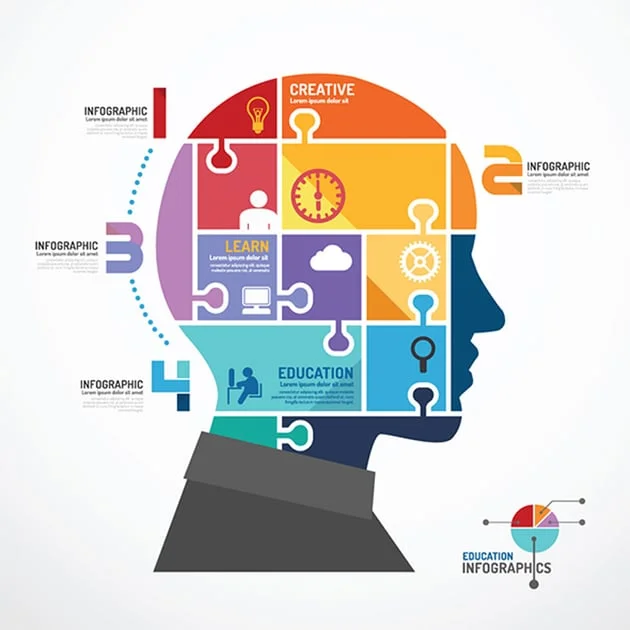
Infographics can encourage students to let their creative side come out by giving them a platform to design and create visual representations of information. Creating infographics allows them to express themselves in new and exciting ways. This can be a fun and rewarding way to learn and develop new skills.
Recommended Reading: How To Enhance Creativity and Imagination in Kids through Art and Craft
5. Interactive Learning

Infographics can be used as an interactive learning tool, allowing kids to explore data, statistics, and other information in a more engaging way. This can help kids stay interested and motivated in the learning process. Moreover, students can grow their memory through infographics as concepts are presented to them in a visual format.
Types of Infographics
There are various types of infographics that can help kids learn faster. Some of them include the following:
1. Educational Posters
This type of infographic is used to teach kids about various subjects, such as science, history, or geography. Educational posters typically feature a visual representation of key concepts, along with short text that explains the concept in depth.
For example, a poster of a c teaches students about the different planets, orbits, galaxy, satellites and their characteristics, and their position in the solar system.
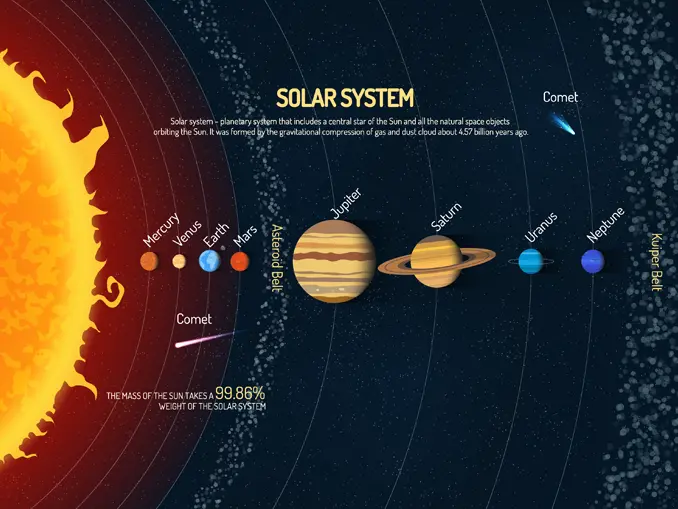
Source: EarthHow
2. Timeline Infographics
A timeline infographic typically shows a timeline progression and is an interesting way of teaching kids about subjects like history. These infographics help students learn about historical events or the order of events in a period. Say, for example, you are teaching students about ‘The American Revolution’, you can use infographics to feature a timeline highlighting all the important dates and events between 1763 – 1783.
Recommended Reading: Finding Your Way with Knowledge: Unlocking the Power of Learning Resources
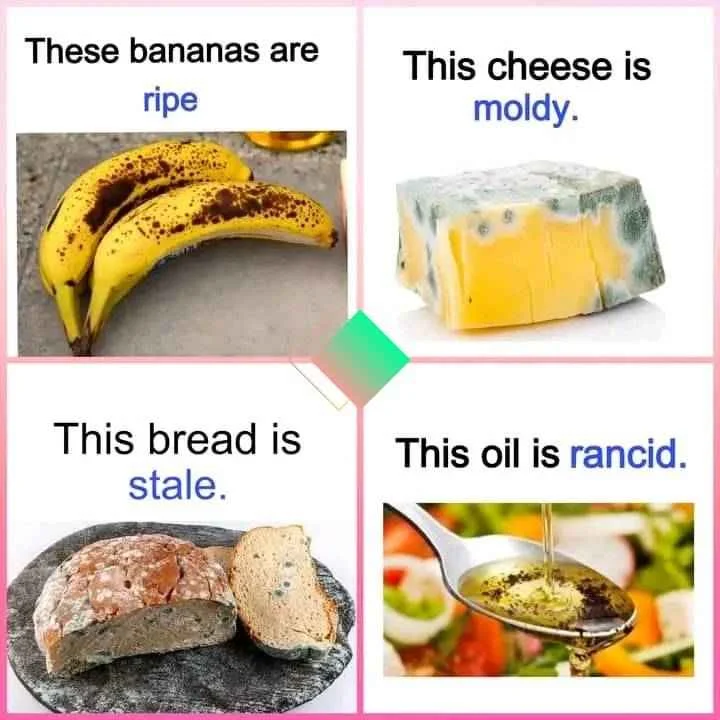
3. Comparison Infographics
Comparison infographics include a combination of visuals and text to teach students about the differences and similarities between two or more things, for instance, comparing different types of animals or different countries or characteristics of two different students. These infographics usually feature a side-by-side comparison of key features.
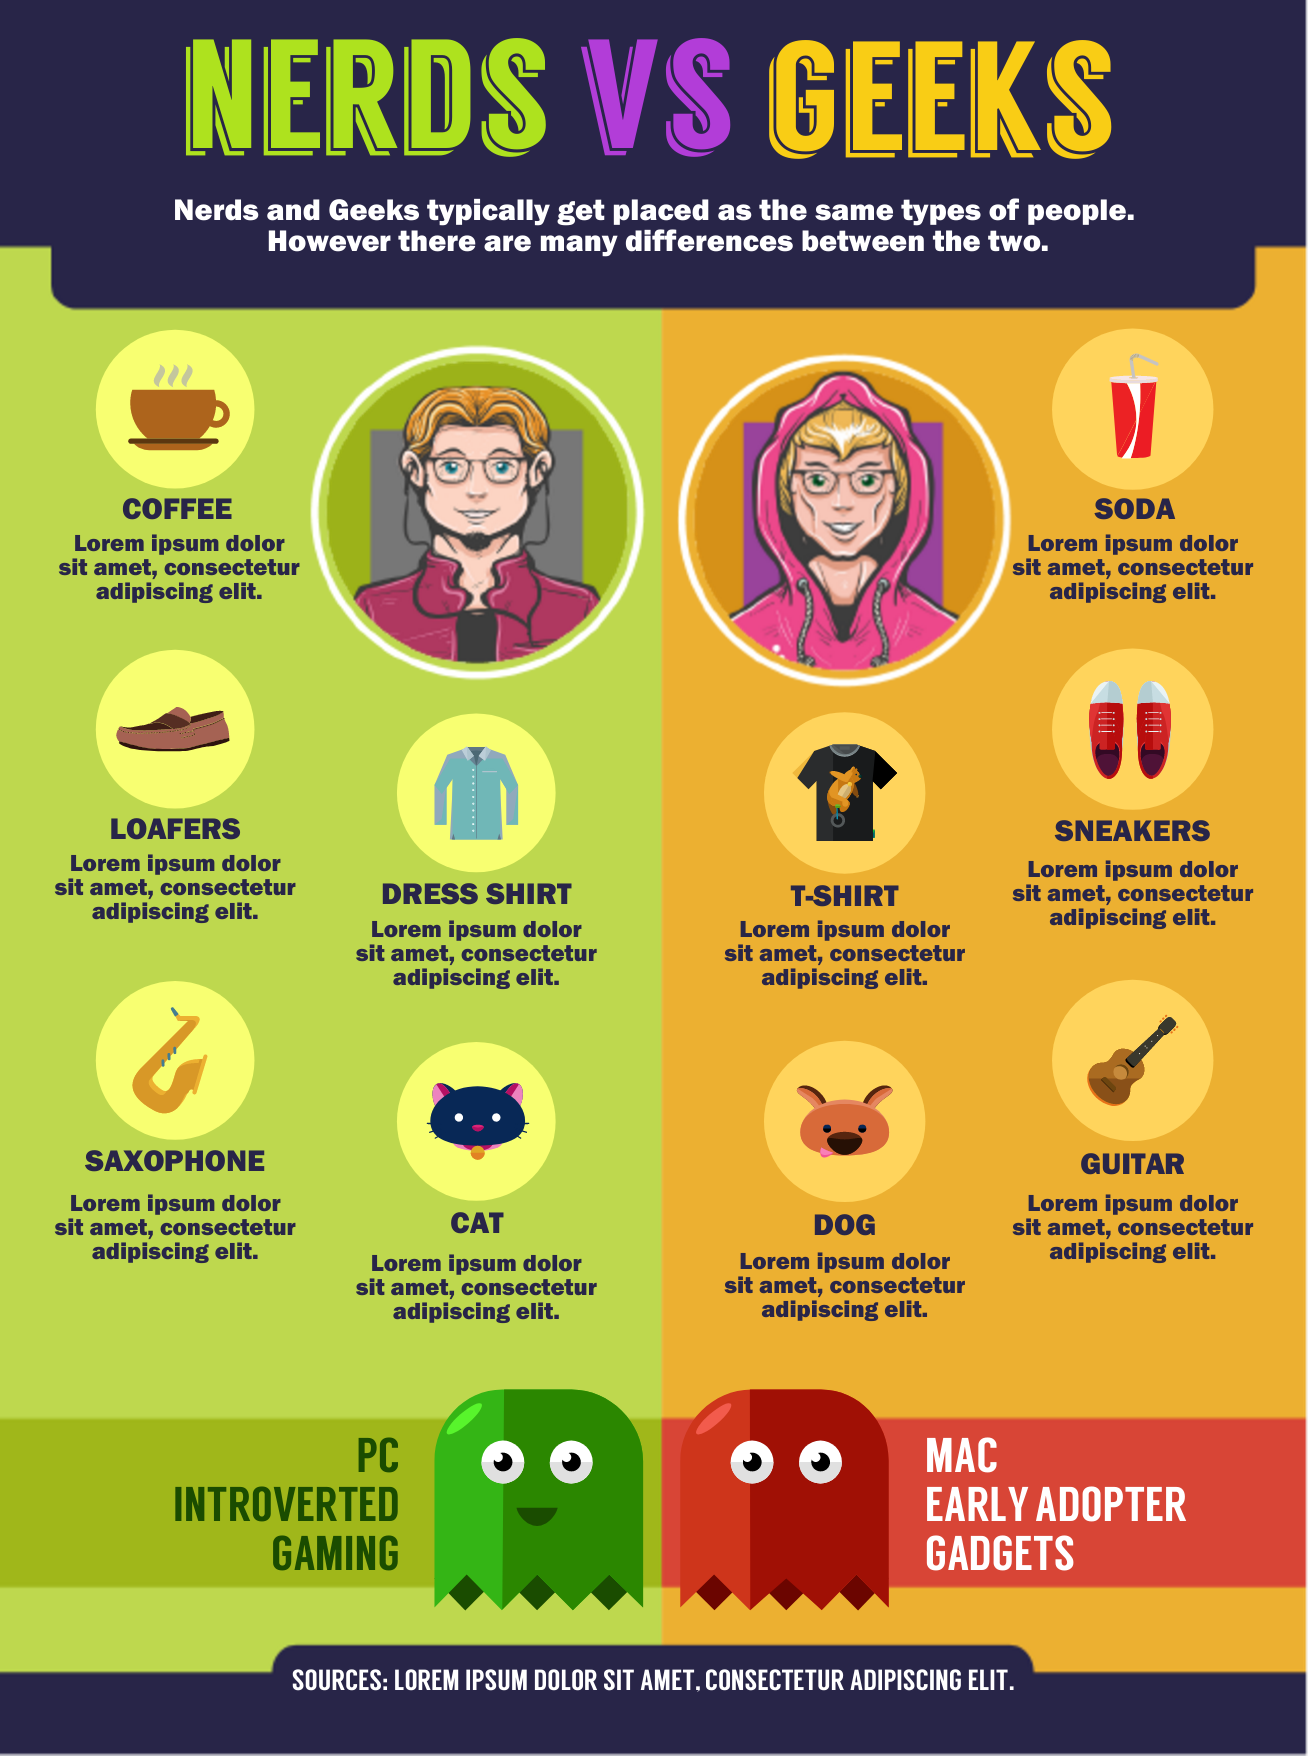
Source: Easel
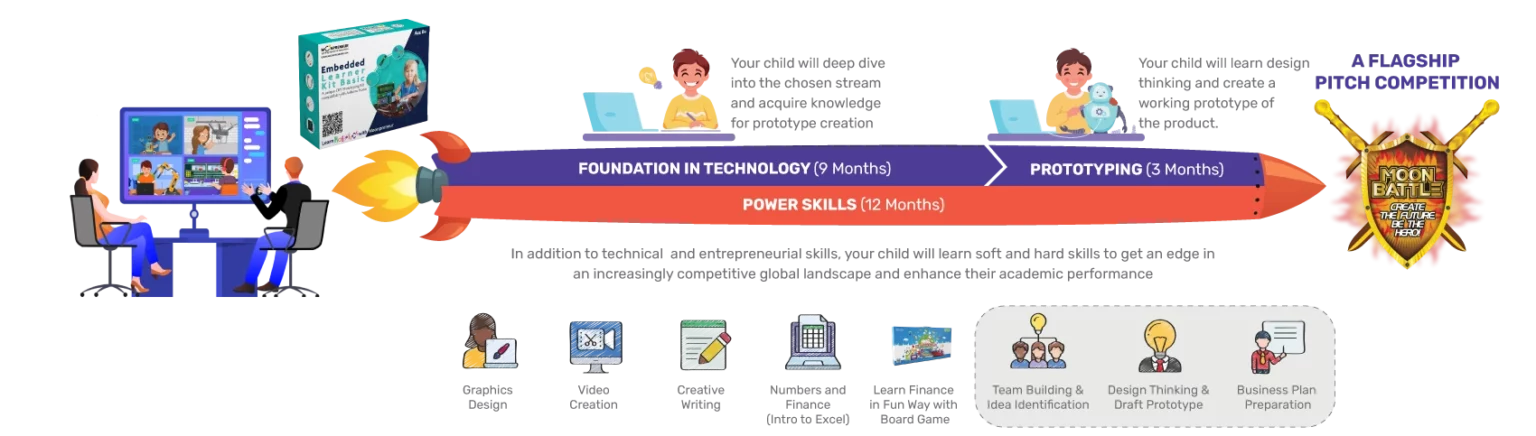
4. Process Infographics
Process infographics can be used to explain various processes to kids by listing down all the steps involved in it in a sequential manner. For example, the lifecycle of a butterfly or the process of photosynthesis. These infographics typically feature a visual representation of each step, along with text that explains the process in more detail.

5. Data-driven Infographics
Data-driven infographics can be used to teach kids about statistics and data analysis. These infographics usually include charts, graphs, and other visual representations of data, along with text that explains the information in more detail.
Conclusion
All in all, infographics have become very popular in the past few years because they enhance the educational experience because help in improving communication between teachers and students. This modern-age tool is particularly useful for representing data-driven information, such as statistics, survey results, or research findings, in a way that is easy to understand and visually appealing. Teachers should encourage their students to use infographics to present information concisely and stay engaged and motivated in the learning process.
Moonpreneur understands the needs and demands this rapidly changing technological world is bringing with it for our kids. Thus we are on a mission to educate and ignite the flames of entrepreneurship through our holistically created online STEM programs, which will help kids master the futuristic sciences such as Robotics, Game Development, App Development, Advanced Math, and much more!!
Register for a free 60-minute Robotics Workshop today!


How can students be inspired to be creative using infographics?
By giving kids a platform to develop and create visual representations of knowledge, infographics foster creativity in them. Students can express themselves in novel and engaging ways as a result, which makes studying enjoyable and fulfilling.
How may an interactive learning tool like an infographic be used?
Using infographics as an interactive learning tool, children may examine facts, statistics, and other information in a fun and interesting way. By using visual aids to improve memory recall, this interactive teaching method keeps students engaged and motivated throughout the learning process.
Infographics, however, have shortcomings. More resources and rigorous analysis are required in light of oversimplification and possible misrepresentation. Interactive exercises and screen-free techniques must be used in balance to prevent screen dependency and passive learning. Alternative format requirements are highlighted by accessibility issues for specific learners.